|
ForeCyt Reference Guide (Version 8.1)
|
Overlay Histogram
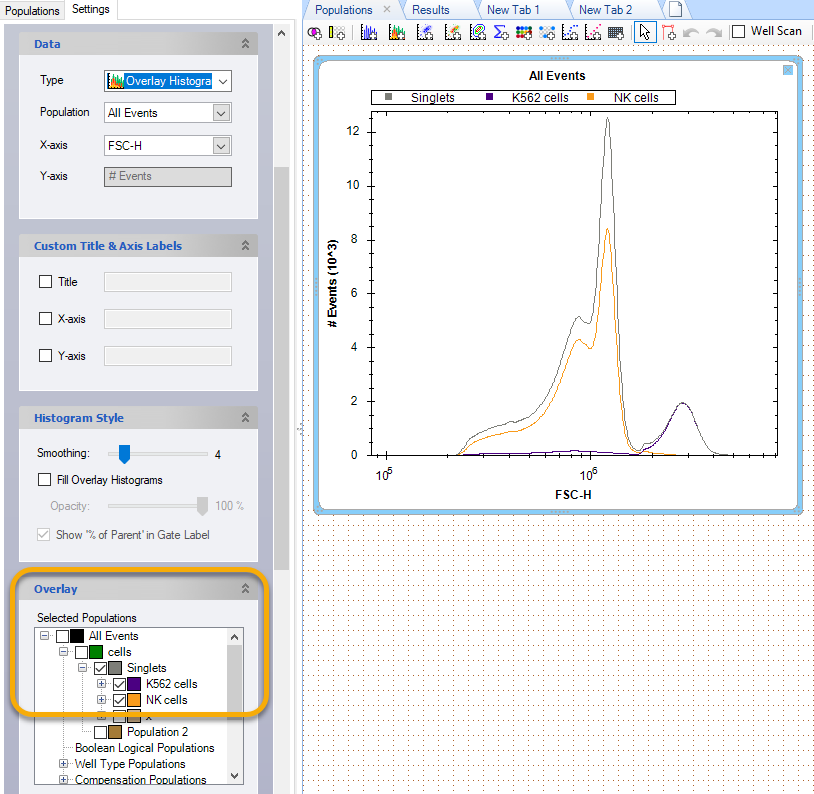
 An Overlay Histogram allows you to visualize and compare multiple Populations superimposed on each other. The following screenshot shows a simple Overlay plot of Singlets, NK cells and All Events.
You can add Populations to the Overlay by dragging them from Populations in the sidebar. Or, you can select them in the Settings tab of the sidebar by clicking on them and clicking Apply.

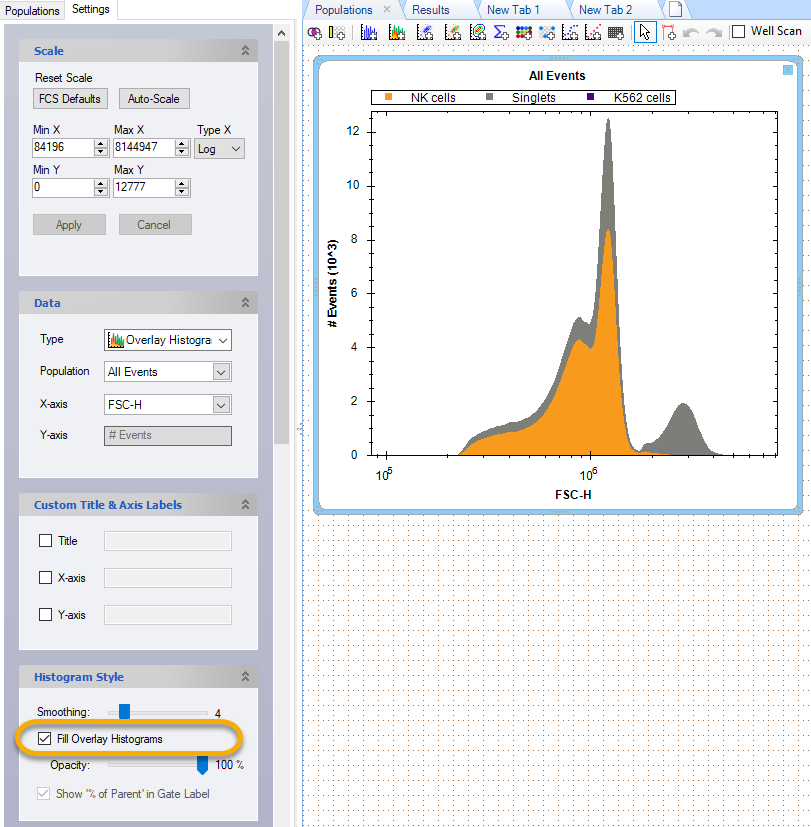
If you want even more comparison between populations in the Overlay Histogram you can check the Fill Overlay Histogram check box. In the following screenshot we turned up the Smoothing slider and set the Opacity of the fill to 100%.

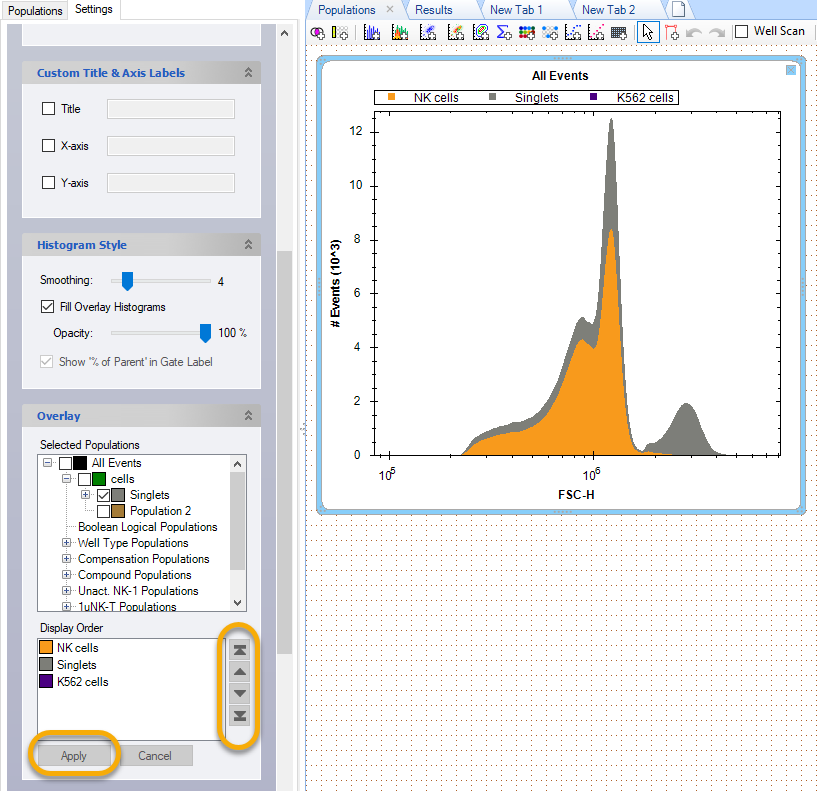
Display Order
Use the arrows in Display Order to change how populations are overlayed. To make the NK cell population more prominent, we moved it to the top in the following screenshot. ForeCyt does not move the population in real-time; you must click Apply
